#Research#
The size of a city is not only essential for depicting the scale of the urban system, but also crucial to support the prosperity, order, and high-speed developments. However, its relation to the underlying urban structure has not been empirically investigated in detail. To examine the impact of city size on the city structure and quantify structural features, in this study, a statistical analysis was performed based on network science and an interdisciplinary theo- retical system. To obtain the statistical law of internal node layout, the urban system was regarded as a complete graph weighted by the Euclidean distance. The relationship between the urban internal nodes layout (points of interest data, Weibo check-in data, and central point of road intersection data) and the city size was established. The results con- firmed the existence of statistical laws in the layout of urban spatial elements, and explored the relationship between the changes in urban node network structure and inequality. This study provided a new perspective of urban structure to understand the complexity of the city, and suggested an approach to adjust this structure to narrow down the gap between the urban and rural areas.
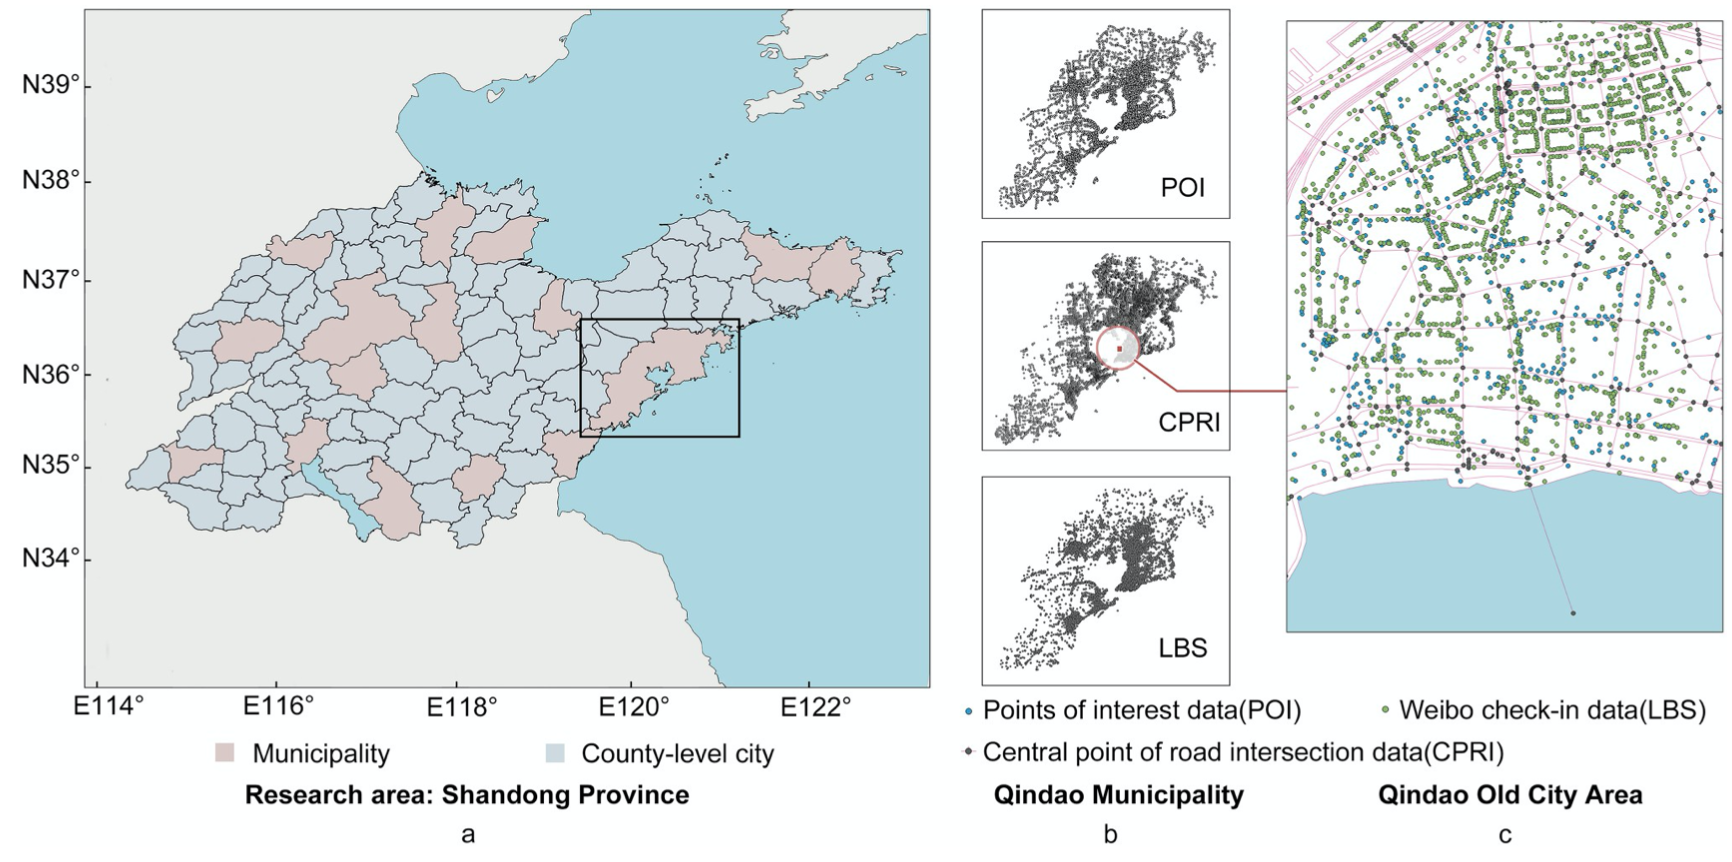
Fig 1. Visualization of the datasets used in this study. a) The division of Shandong province into 95 cities; b) Spatial pattern of three types of datasets of Qingdao; c) Spatial pattern of all the datasets of Qingdao. © OpenStreetMap contributors.
Study Area
The selection of the study area is critical to ensure accurate data fitting and measurement; thus, it has to meet the following standards:
- To ensure that the logic of urban development is as similar as possible, the cities in the study area should have similar contexts and development policies
- To ensure the continuity of population data, the study area should have a homogeneous distribution of population in the region and a strong hierarchical structure of cities
- To avoid statistical errors, there should be no overpopulated and undersized cities in the study area Given these prerequisites, Shandong, China was chosen to be the target region in this study, which is located along the east coastline in China. Compared to other provinces, the cities of Shandong province have smaller gap in development but stronger hierarchical structure in size, which guarantees a more consistent data sample.
Data
- Central Point of Road Intersection data(CPRI).
- Points Of Interest data(POI).
- Weibo check-in data(LBS).
- GDP data from statistical yearbook.
Results
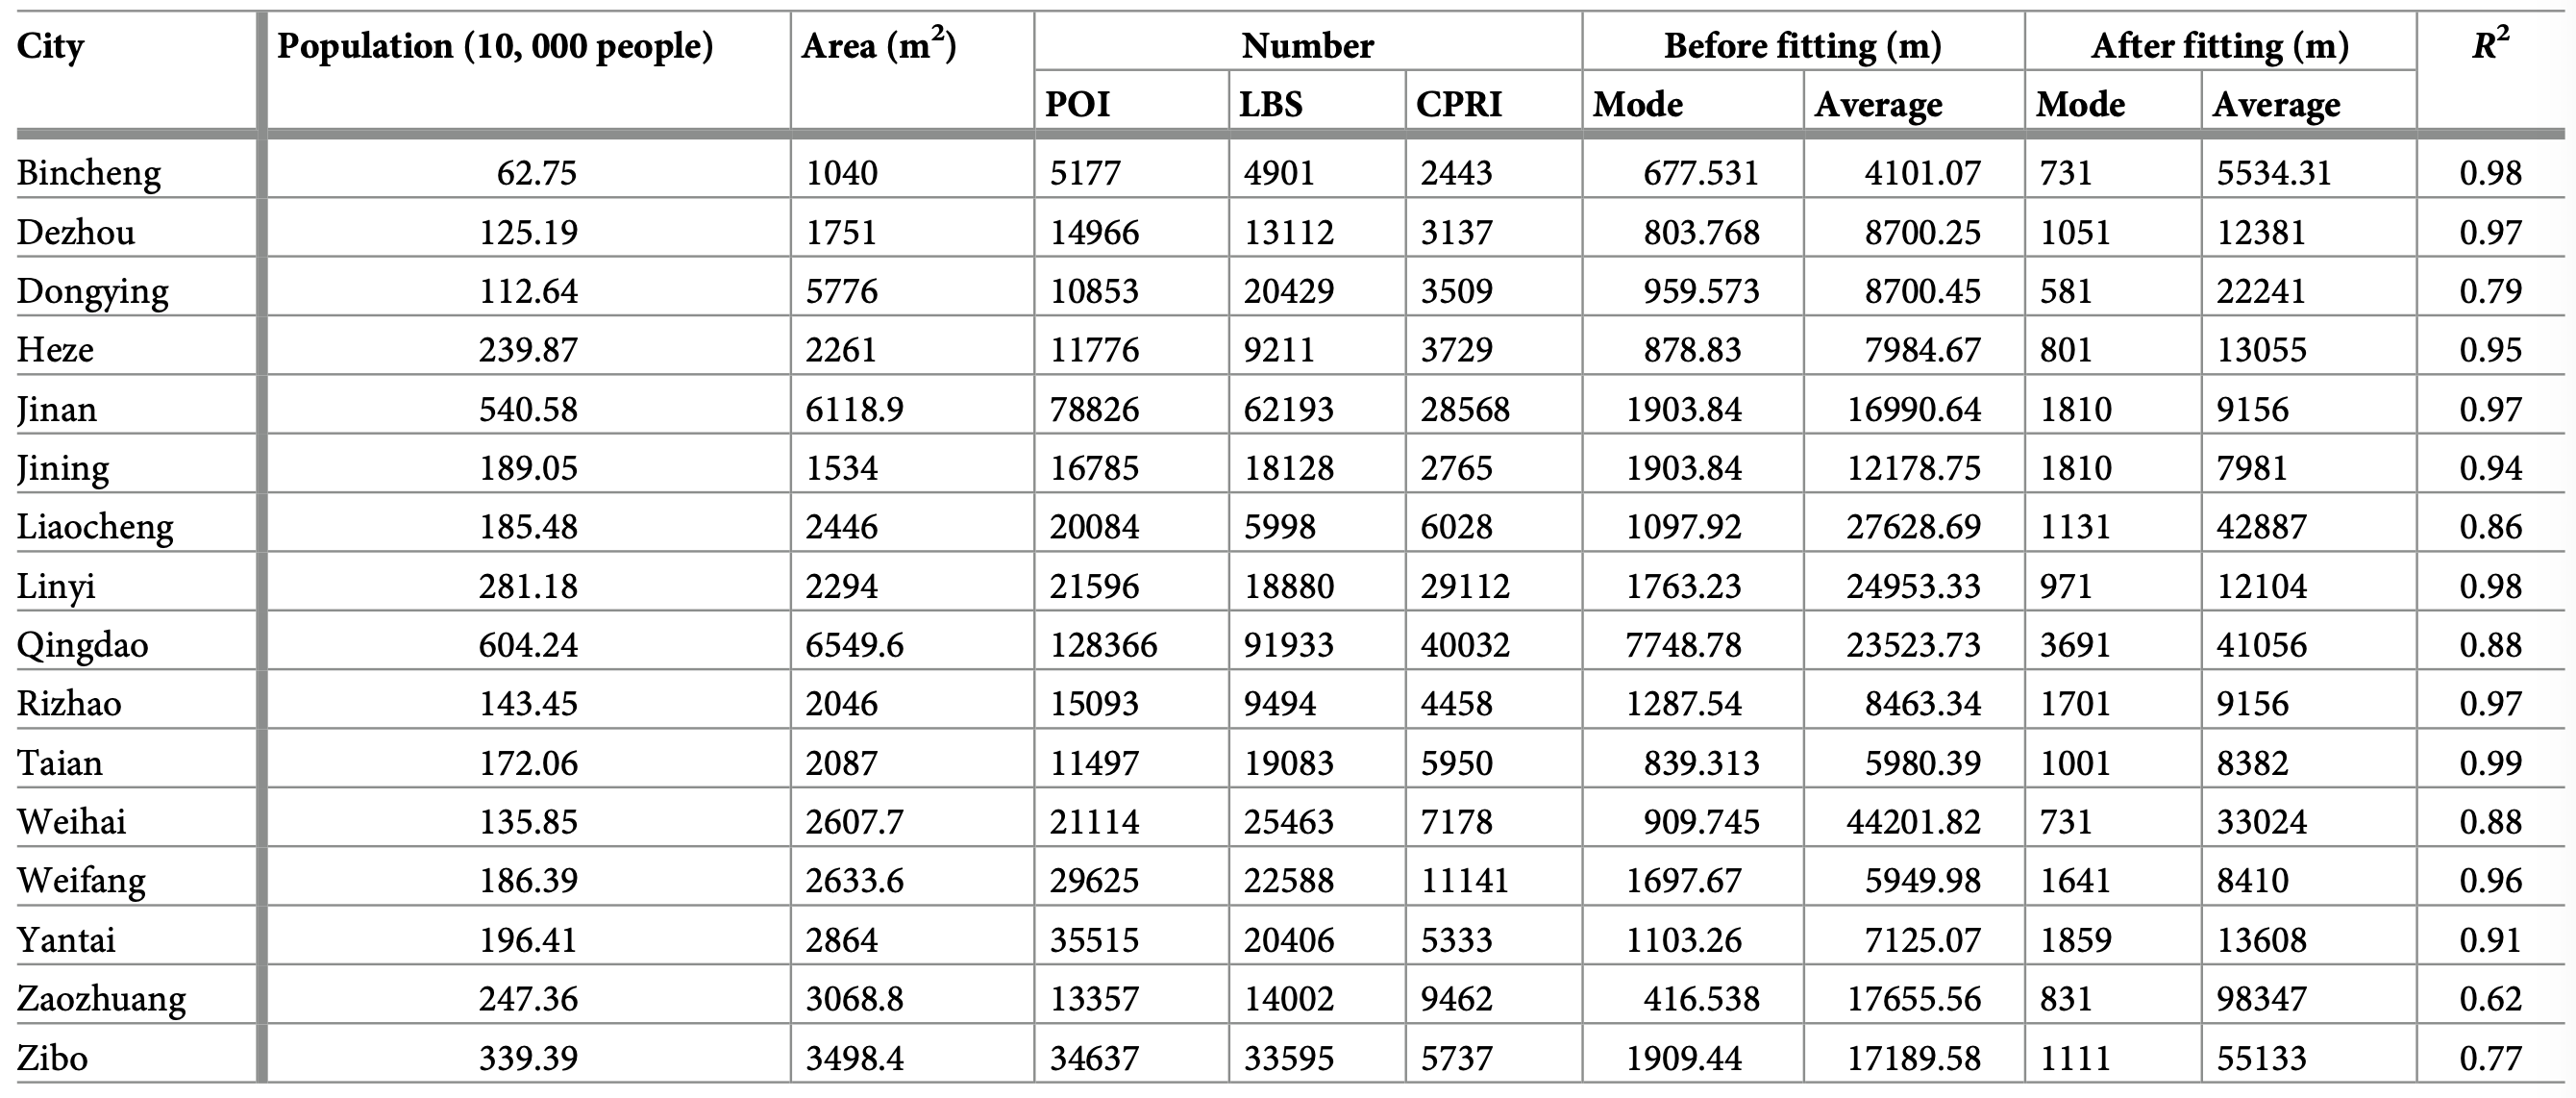
Table 1. Statistics results of 16 prefecture-level cities.
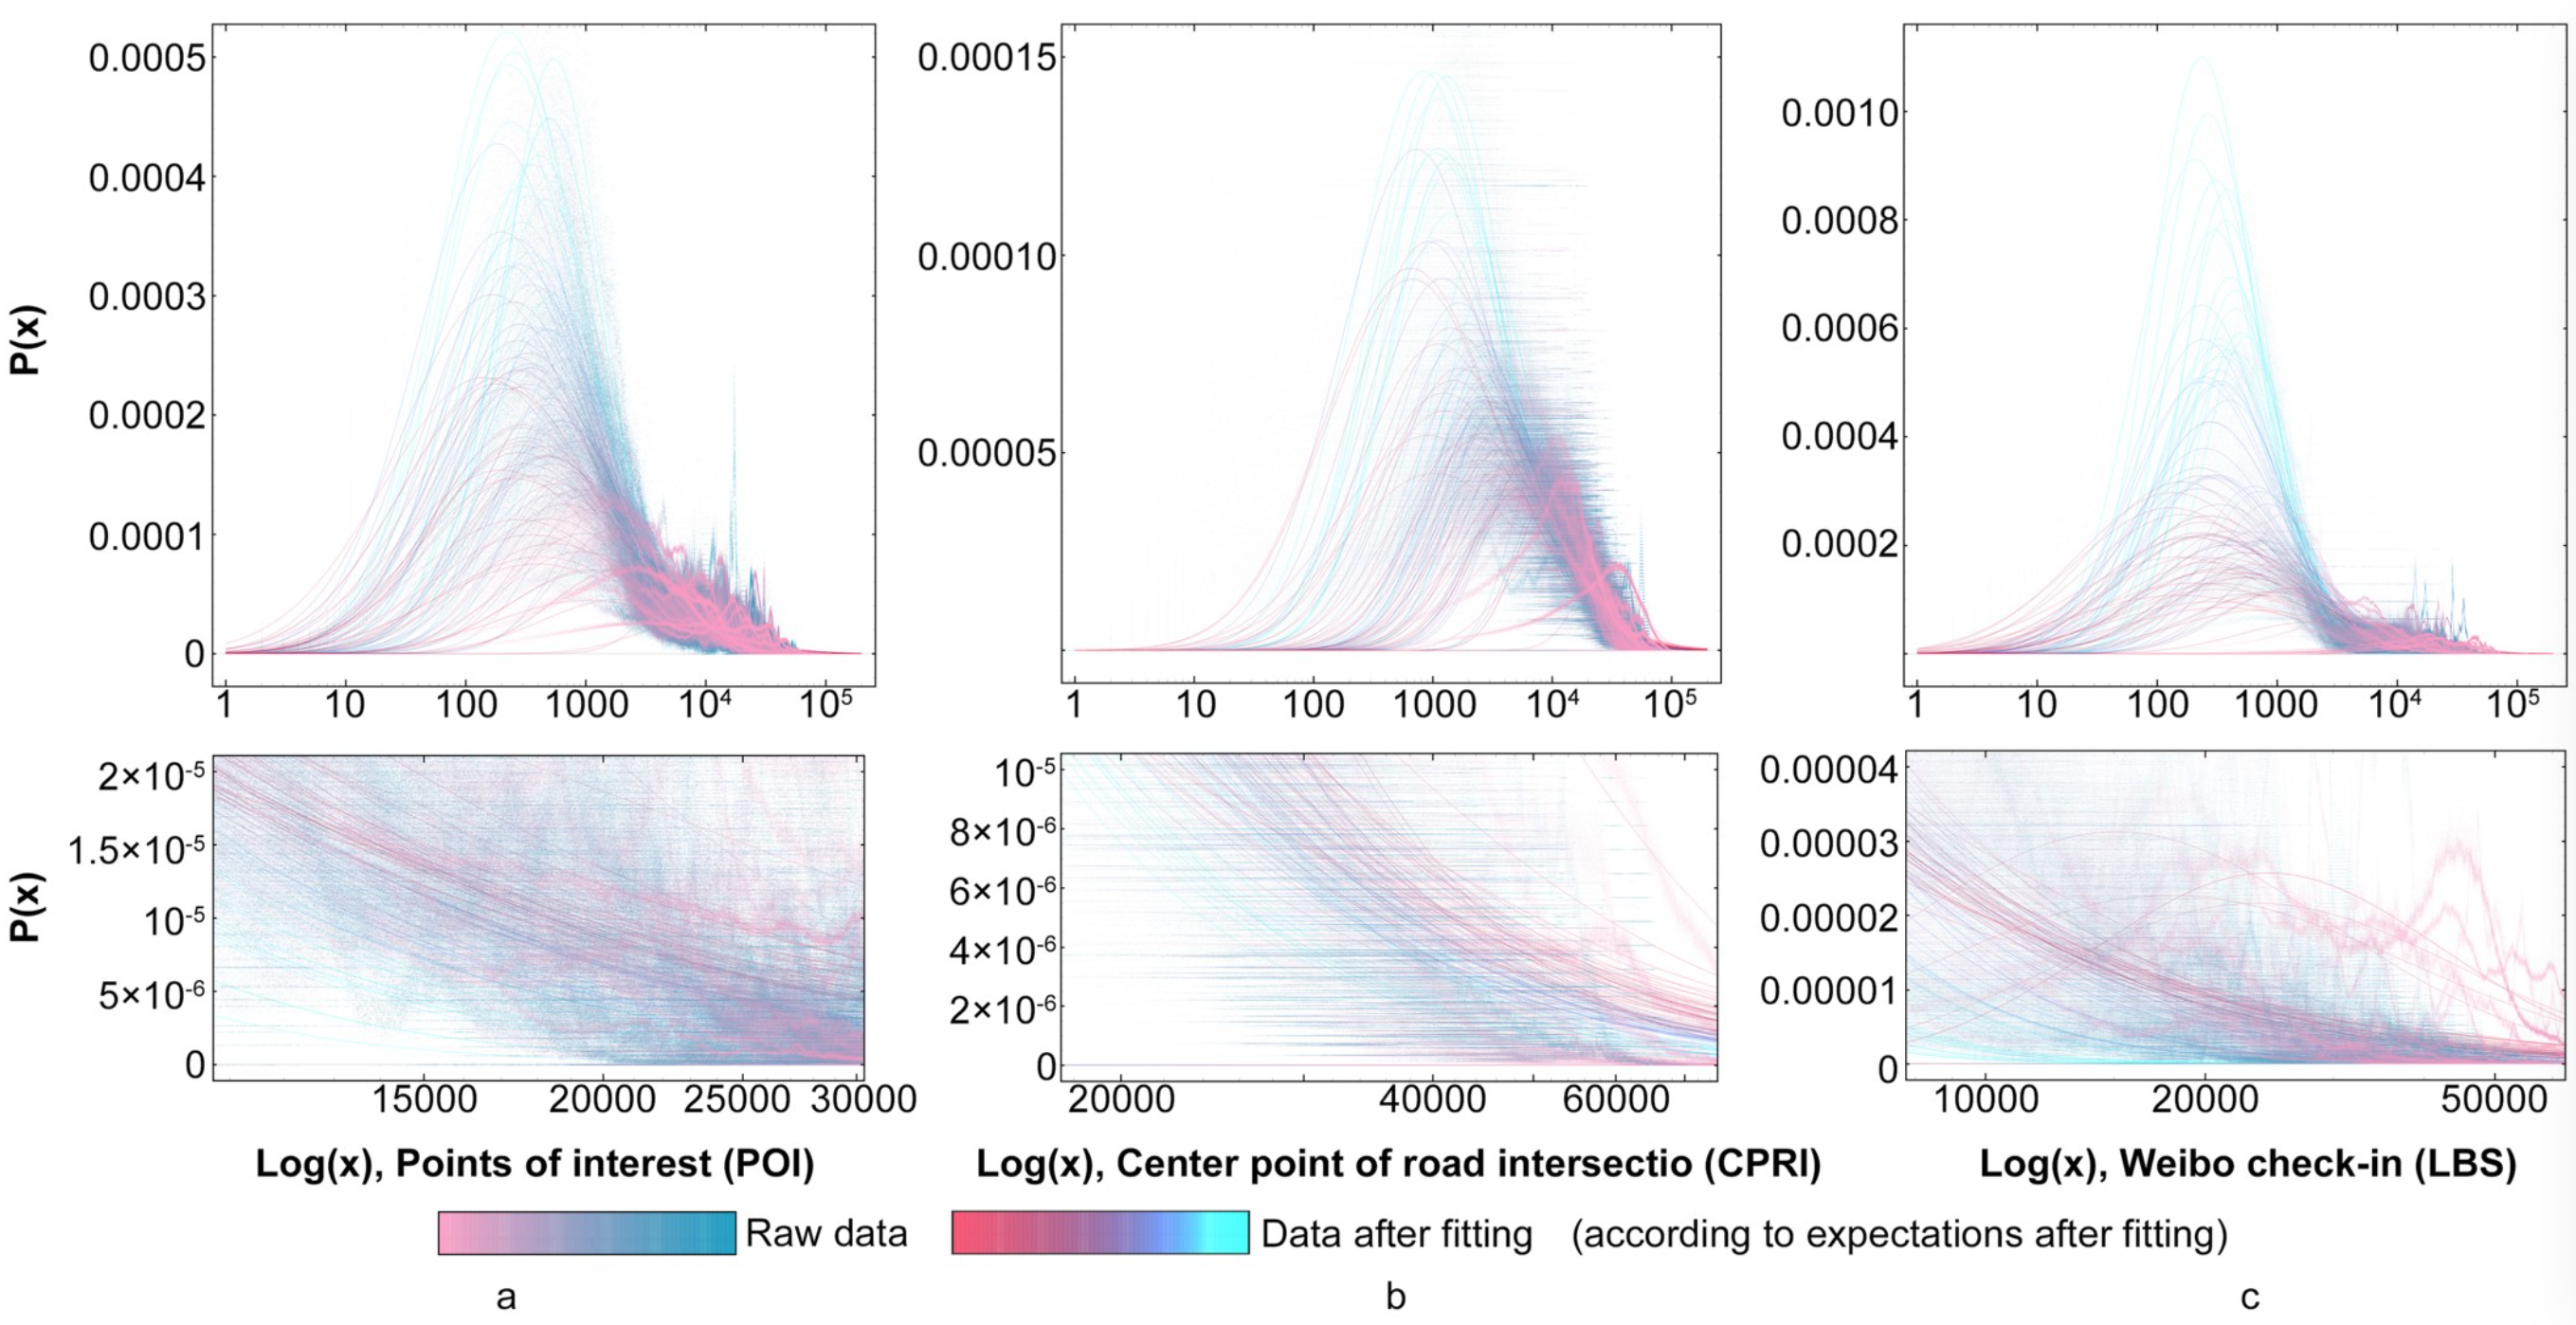
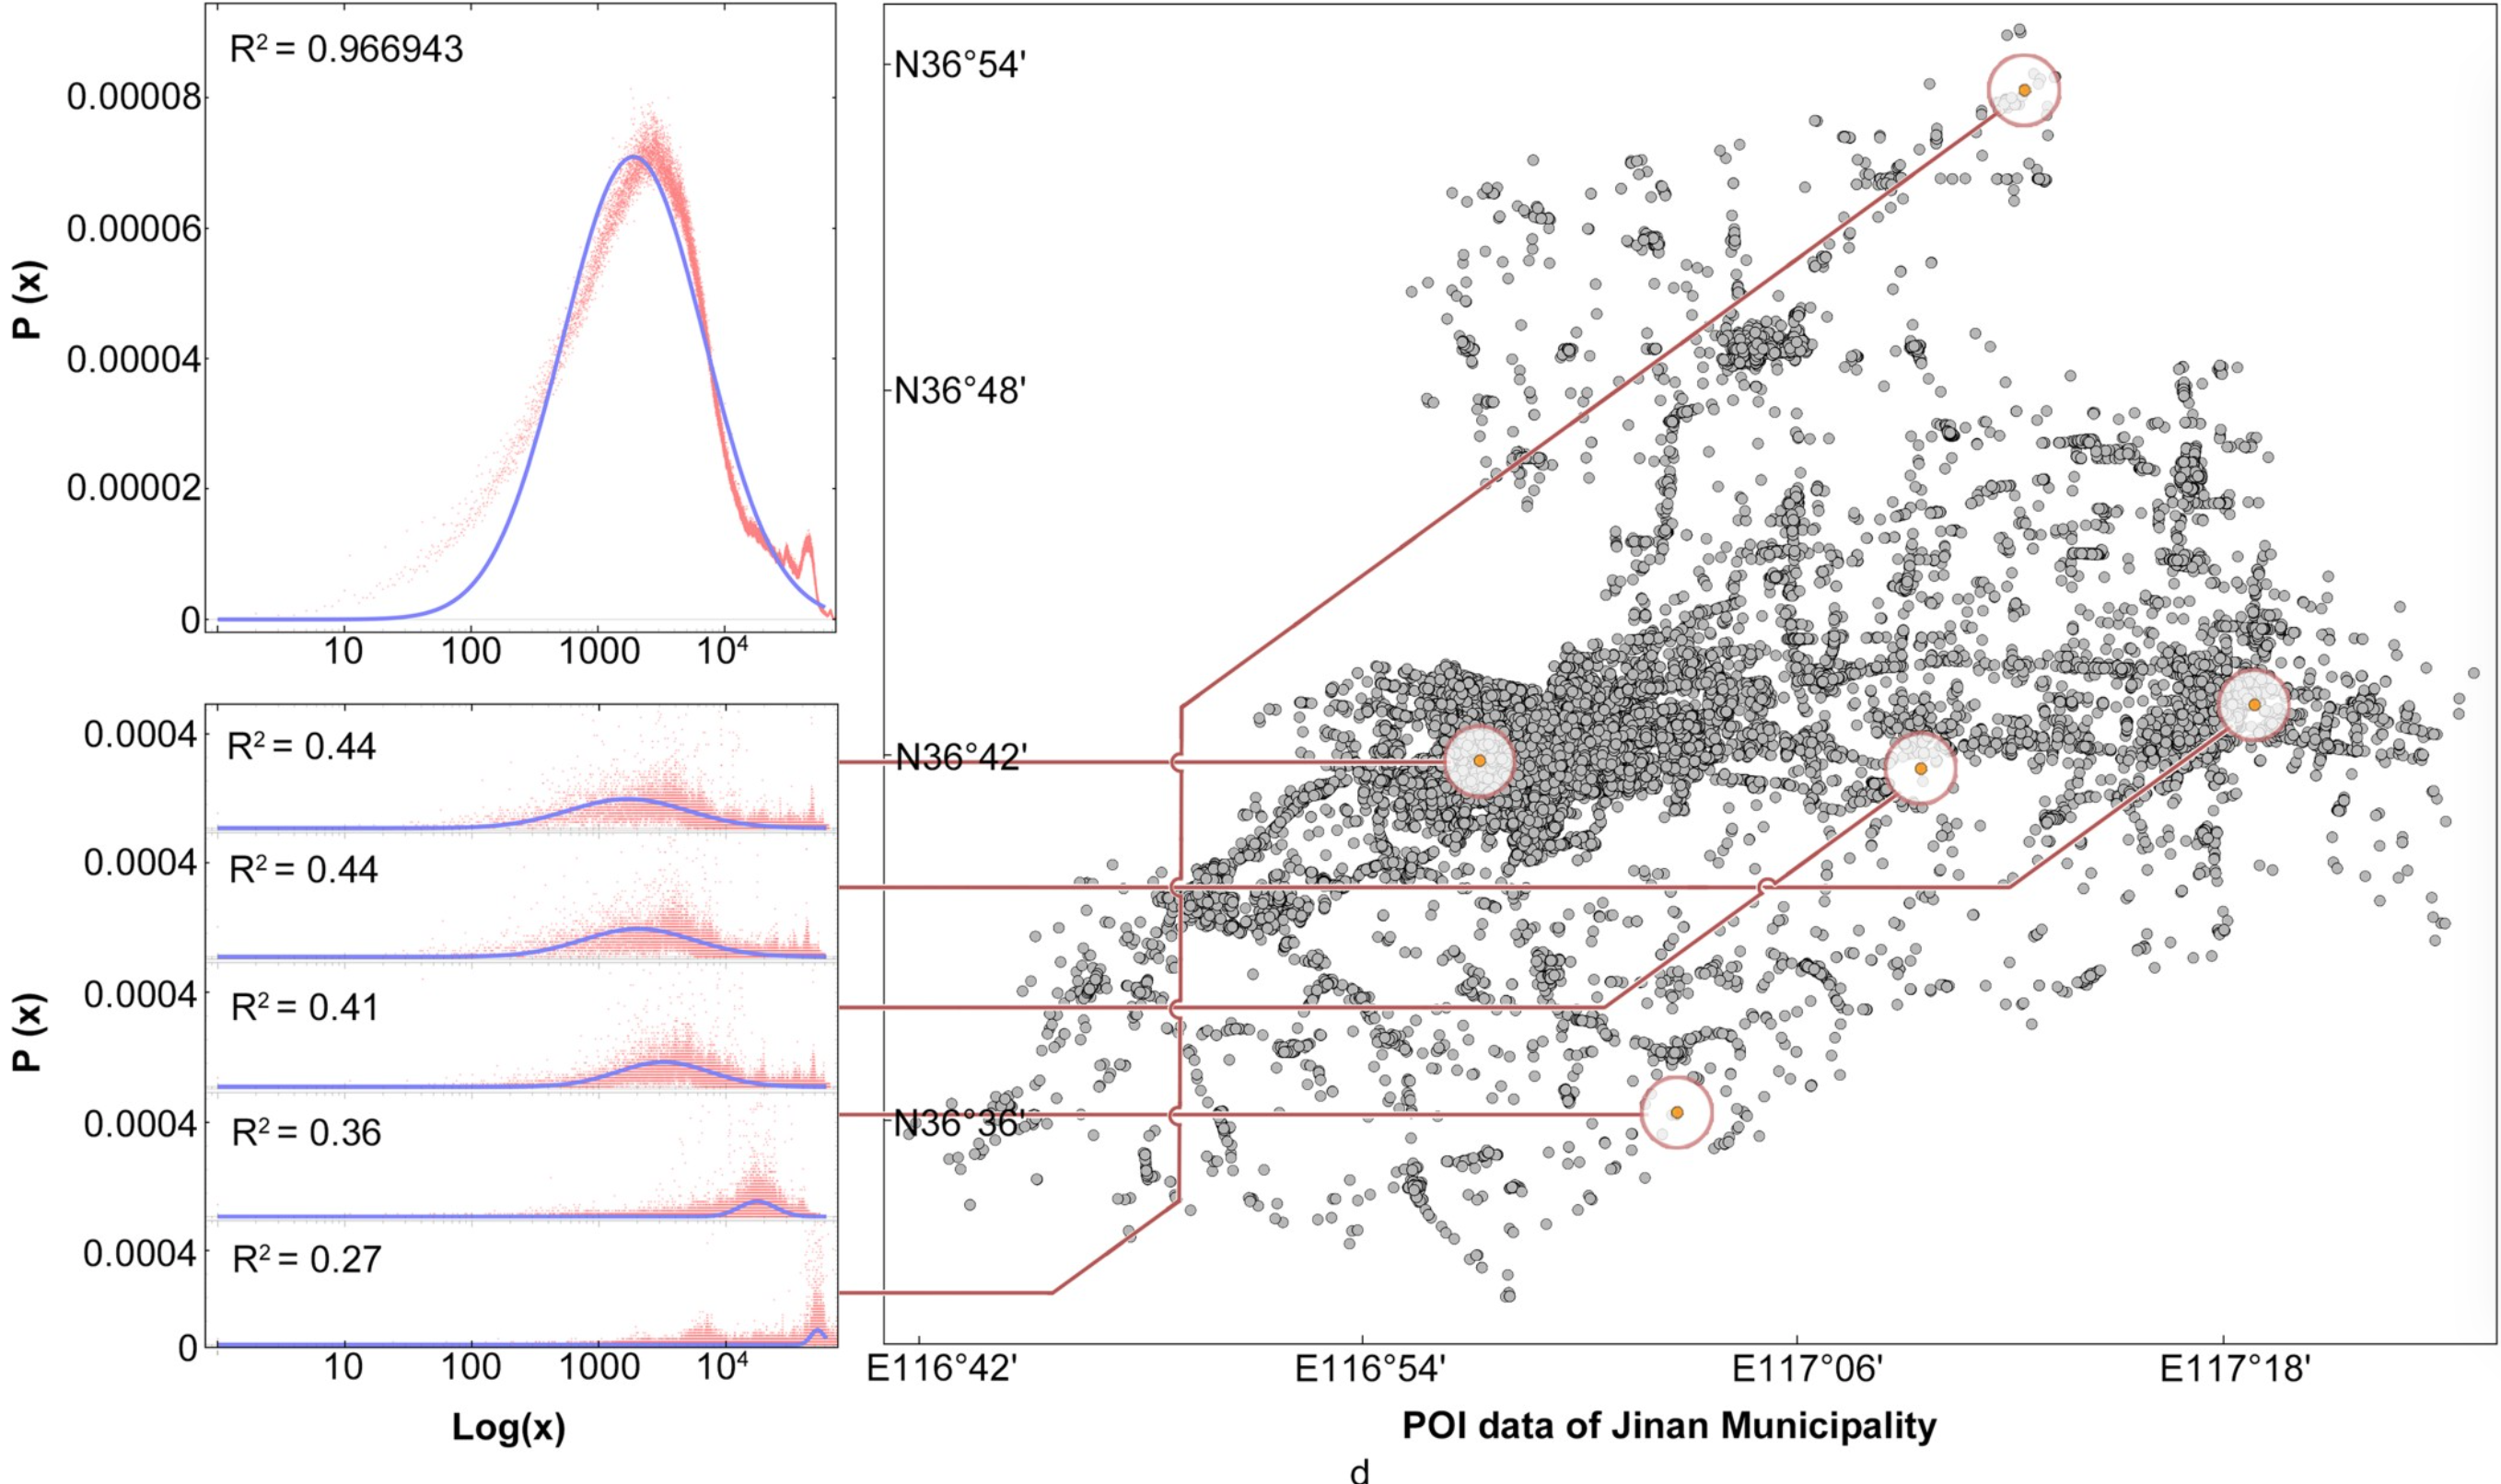
Fig 2. Visualization of data statistics. a) Log(x) of POI; b) Log(x) of the center points of road intersections; c) Log(x) of LBS; d) Log(x) of POI data and spatial pattern of Jinan Municipality.
Based on these statistics, we observed that the frequency distributions of different distance val- ues share similarity in ascending order. In other words, they all demonstrated a type of skewed distribution, which fits well with the log-normal distribution model. The statistical result of 16 prefecture-level cities are illustrated Table 1, while the data of 95 cities are presented in S1 Table. According to these statistics, it can be stated that the fitted variance above 0.8 accounts for 92.63% of the overall results, while that above 0.9 accounts for 63.16%, which indicates a good fitting effect. The three different types of original data and corresponding fitted curve in the coordinate system are shown in Fig 2a–2c. To better illustrate the peak state distribution of the data, we assigned different colors according to expectations after fitting, and processed the data using a log-linear coordinate system to ensure the normal distribution of data. The detailed diagram at the bottom shows the tail state of the distribution.
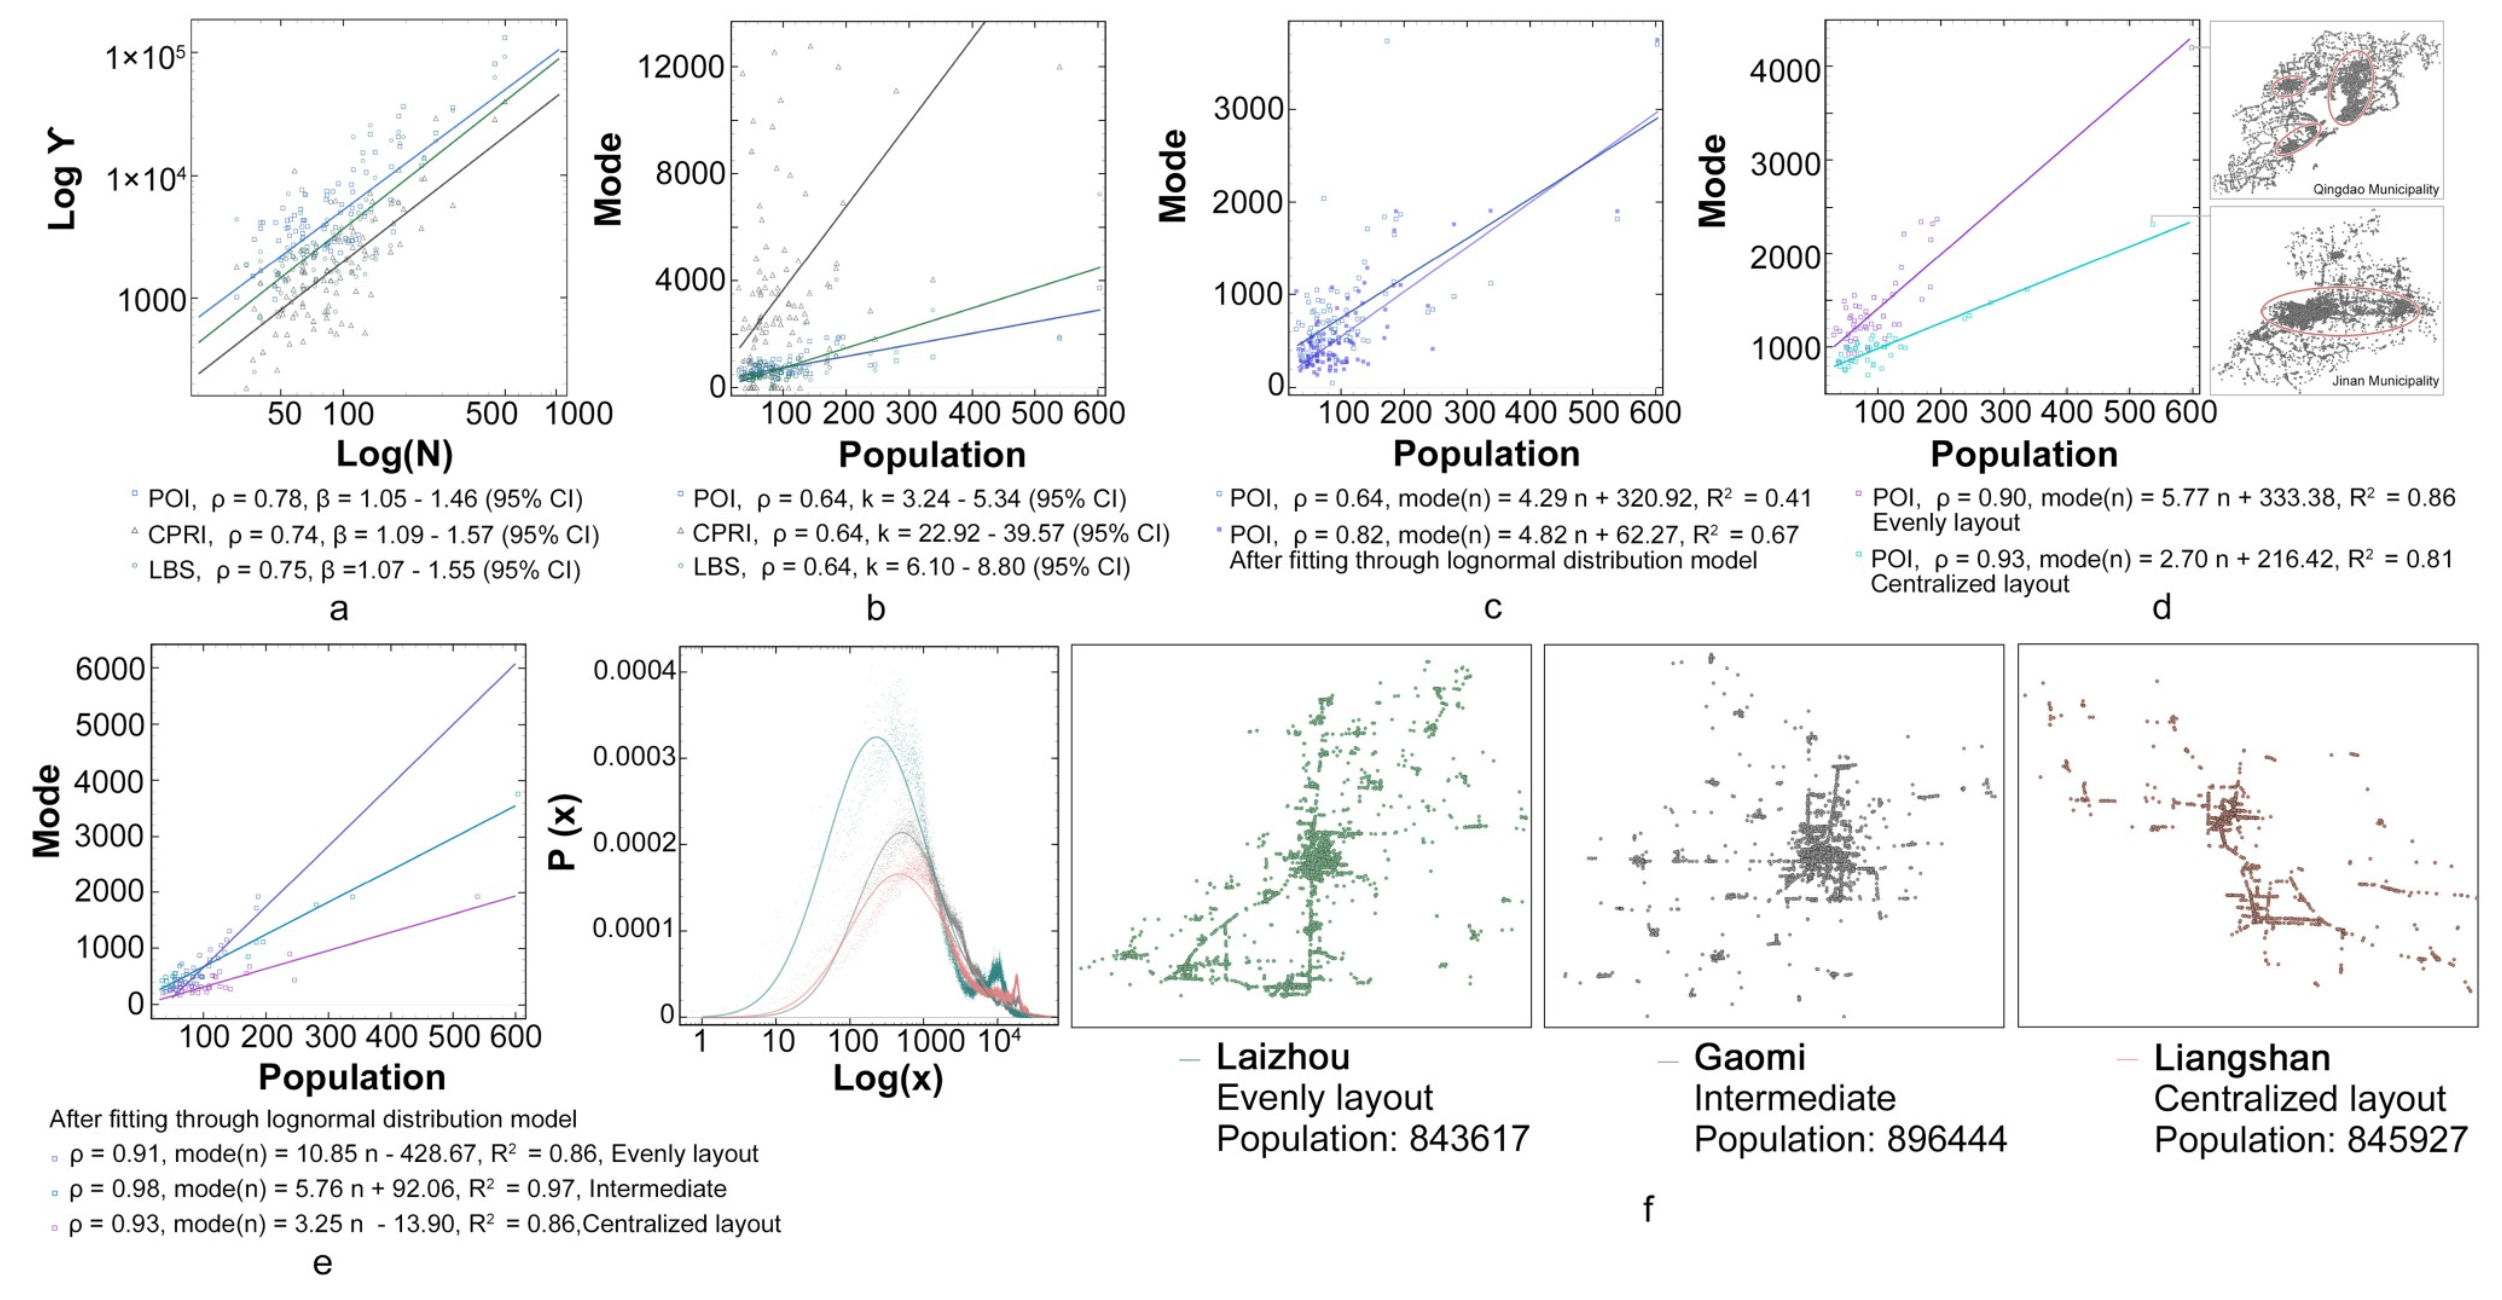
Fig 3. Relationship between internal node layout and the city size. a) Shape of three data types after model fitting; b) Plot of relation between datasets and population under 95% confidence interval; c) Correlation between the mode of POI data and population before and after the log-normal distribution fitting; d) Two classification results of the POI data; e) Three classification results of the log-fitted data; f) Curve of data in log-linear coordinates and spatial patterns of the three cities.
In addition to summarizing the statistical characteristics of the internal node layout of the city, we further investigate its correlation with the city size, which proves to be a power law between the total number of data Y and the city size. The correlations of three different data types become significant at the level of 0.01, with all the Pearson coefficients ρ being above 0.7, lead- ing to a high correlation. The three datasets and their fitted shapes are illustrated in Fig 3a.
By statistical analysis and information comparison, we find that the modes of the three data types exhibit a significant relationship with the city size at the level of 0.01, with all the correlation coefficients β being 0.64, which is a medium correlation. This indicates that there exists a positive correlation between the data distribution of these three types and the city size. In terms of the human behavior pattern, this mode could represent the distance in the network. In behavior analysis, the highest frequency behavior is always more representa- tive than the average or other characteristic values. Therefore, the slope between the data and city size is defined as k. According to Fig 3b, under the 95% confidence interval, k of the POI data is 3.24–5.34, road intersection data (CPRI) is 33.92–39.57, and the LBS data is 6.10–8.8. The comparison of the correlation between the mode of POI data and the population before and after the log-normal distribution fitting is illustrated in Fig 3c. To better reflect the possible characteristics of the overall urban system, the impact of outliers on the overall data can be decreased by fitting. Therefore, the correlation with the population size is stronger. However, the wider value range of k indicates the instability of the data.
To reduce such data instability and improve the effectiveness of fitting, the degree of data dispersion is related to the spatial structure of the city. For example, areas where large numbers of nodes gather result in data dispersion of different degrees. Therefore, cities can be classified based on their spatial structure, which can greatly improve the fitting effect. The classification results of the original POI data are presented in Fig 3d.
The classification results of the log-fitted data are plotted in Fig 3e. Here, to achieve better fitting effect, the data are categorized into three layouts, namely, even, intermediate, and cen- tralized. According to these three categories, we take three cities with similar population sizes (Laizhou, Gaomi, and Liangshan) as examples. The performances of these three cities in the log-linear coordinate system and the corresponding geographic distribution of the urban space are demonstrated in Fig 3f. Among them, Laizhou has many urban centers, and thus, presents more small concentrated areas, resulting in a more uniform layout picture as a whole. Although Gaomi has a single urban center, multiple small-scale concentrated areas exist in its countryside. Compared to the Gaomi urban structure, the rural areas in Liangshan are highly underdeveloped; consequently, the gap of urban–rural dual structure is large, resulting in a small k value.
Conclusion
Based on three different spatial data, this study verified the relationship of city size and structure. Through statistical analysis and parameter definition, the impact of urban structure on regional inequality is quantified. The following conclusions are drawn:
- The probability that the distance between all nodes in the city conforms to the log-normal distribution in ascending order, and the distance of the highest probability value (i.e., the mode of the relative distance) is positively related to the size of the city.
- Taking a certain node in the city as the starting point, as the distance increases, the probability of other nodes appearing geographically conforms to a kind of off-peak distribution, which is in between the log-normal and the normal distributions. The location of the peak is related to its geographic position.
- Due to the linear correlation between the mode of relative distance and the population, we defined its conversion rate k as an indicator to quantitatively describe the urban structure; it can better explain the correspondence between the statistical data and the urban network layout.
- By comparing the relative distance mode, population conversion rate k, urban–rural gap, and population power parameter g, we investigated the relationship between the urban–rural gap and the mode, and defined the utility formula using the mode to narrow down the urban–rural gap, which can explain the difficulty in narrowing the urban–rural gap in cities, and the relationship between the urban structure and size.
- We deduced the utility formula between urban development and urban structure. The utility formula can be applied to address regional inequality, and explained the differences in the urban development of cities with similar sizes from the perspective of urban structure. The derivation results prove that, in the case of the same population size, the urban structure that is scattered at the macro level and concentrated at the micro level has greater development potential.
To summarize, this study achieved statistical laws existing in the layout of urban spatial elements and developed an approach to quantify the features of urban structures. It provided a new perspective of urban structure to understand the complexity of a city.
Collaborators: Bayi Li, Zebin Chen, Peng Liu.
For the full paper see:
Feng, W.*, Li, B., Chen, Z., Liu, P. (2021). City Size Based Scaling of the Urban Internal Nodes Layout. PLOS ONE, 16(4): e0250348. doi:10.1371/journal.pone.0250348